I built a machine that reads the world's news

This is the first post in a series about FlatNine Intelligence, a platform I have been building to read the world at macro scale. This one is about the part I needed most: the news feed at intelligence.flatnine.co/news.
I have a confession that is a little embarrassing for someone who builds software for a living: I cannot keep up with the news.
Not the headlines. The headlines are the easy part, there are far too many of them and they refresh faster than anyone can read. The thing I genuinely cannot do is hold the whole picture in my head at once and answer the only question I actually care about: where is this going? Is the thing I read about this morning a blip or the start of something? Is that region heating up or cooling down? Is the market quietly pricing in something the coverage has not caught up to yet?
I would read for an hour and come away with more facts and no more understanding. What I wanted was not more news. It was a sense of direction, with some honesty about how sure I should be.
So I built one.
What it actually is
FlatNine Intelligence reads the world's news as a stream of structured events, builds a graph of relationships out of it, and surfaces a feed of short, AI-written sentences about where things are going. Each sentence carries a signal-strength number, and the system is careful to say that number measures how big the shift is, not how likely an outcome is.
It is deliberately not a news aggregator, not a sentiment dashboard, and not a chatbot you ask questions to. It is a reasoning engine sitting on top of a news graph, with the prose written by a language model under very tight constraints.
The core question it tries to answer is the one I kept failing to answer myself:
given everything that just happened in the world, what shifted, and how confident should we be that those shifts mean something?
Where the signal comes from
The feed reads from three independent streams, all landing in the same events table:
- GDELT, a global feed that drops a fresh batch of events every 15 minutes, drawn from news media in 100+ languages and tagged with a standard ontology of conflict and cooperation. This is the firehose.
- RSS feeds from the outlets GDELT under-represents: think tanks and OSINT shops like CSIS, Brookings, CFR, RUSI, Defense One, War on Rocks, Bellingcat, plus mainstream wires as ground truth.
- FRED economic indicators: the Fed funds rate, CPI, unemployment, oil, FX, the VIX. The macro substrate, so a claim about rates or energy can be sanity-checked against the actual numbers and not just the framing of an article.
Every event gets tagged at ingest with a publisher tier (a Reuters wire counts more than a regional daily, which counts more than a content farm), a topic, and an escalation flag if the headline uses the language of things going wrong.
The graph
This is the part I find genuinely beautiful. Every entity that matters (a country, a person, an organization, a place, even an economic indicator) becomes a node, and it carries a canonical Wikidata ID so that "the IDF" and "Israel Defense Forces" never split into two different things. Every time two entities show up in the same event, an edge forms between them. The edge means "these two were talked about together," not "X did something to Y."
Then I run a recursive version of PageRank over that graph: an entity is important when other important entities are entangled with it, all the way down. I call the resulting score gravity. Old edges decay with a 14-day half-life, so the graph reflects this week's world and not last year's. Without that decay it would just fossilize.
Gravity is what lets the system notice that something is becoming a focal point before I would have noticed it myself.
How a sentence gets made
The system does not let the model wander off and write commentary. There is a fixed, small catalogue of patterns it looks for in the graph, things like:
- an edge between two entities suddenly carrying twice the weight it used to (a relationship intensifying)
- an entity's gravity surging or collapsing
- the tone around a topic hardening or softening
- three entities all tightening toward each other at once
When one of those patterns fires, the system writes a claim. And here is the one rule that the whole thing is built around, the rule that makes it different from "an AI reads the news and tells you what it thinks":
The prose and the number never touch.
When a pattern fires, the system first computes the number from the raw signal magnitude. Then it hands the language model the pattern type and the underlying facts, but never the number, and asks for one short, neutral sentence. No probabilities in the prose, no hedging, no drama. Low temperature. The exact prompt is hashed and stored on every claim so I can audit drift later.
So two things come back: a sentence written by the model, and a confidence computed by the math. They get paired in the same row. The model never knew what number its sentence would be stapled to, and the math never knew what the sentence would say. That separation is the whole point. It is what stops me from getting a confident-sounding paragraph that is secretly making its probabilities up.
The honesty layer
A number is worthless if you do not know whether to believe it, and the easiest way to lie with one is to dress a guess up as a forecast. So the number on every claim is deliberately not a probability. It is a signal-strength score from 0 to 100: a measure of how big the shift in the underlying graph is, and nothing more.
That distinction is the whole point. A claim like "the Strait of Hormuz is seeing a sharp escalation in activity" at 70 is saying "the underlying signal is strong," not "there is a 70% chance of something happening." The system is built to report the size of what it is seeing and to refuse to pretend it knows the odds of an outcome it has no honest way to check. It would rather tell me it is measuring a tremor than guess at the earthquake.
Two witnesses
The signal cross-checks two independent places: the news graph and the FRED macro indicators. Where they agree, I trust it more. Where they disagree, that disagreement is itself the interesting thing. A graph signal that is invisible in the macro numbers might be a real story the market has not priced in yet. An indicator moving with no coverage behind it might be the market expecting something reporters have not caught. The system surfaces the divergence instead of averaging it away.
What it feels like to use
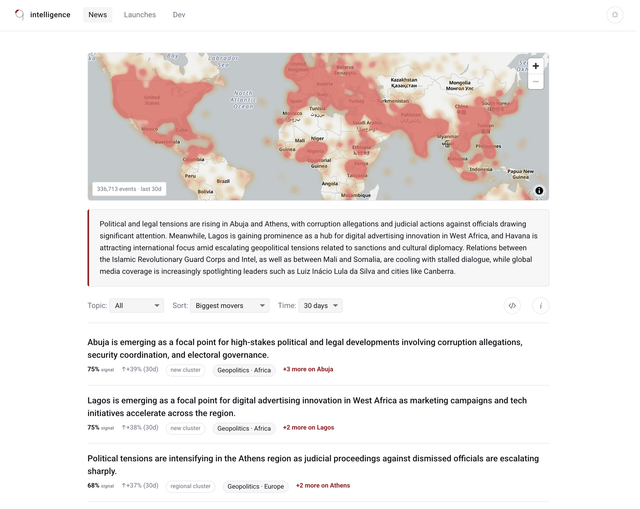
The feed is a list of sentences, each with a signal-strength score, how much it moved in the last 7 days, and a tiny 14-day sparkline so "78 right now" becomes "78 and rising all week." Above it sits a heatmap built from every single ingested event, so the density on the map is real, not a sample.
Click any sentence and you get the reasoning: a short written summary of what is happening and what to watch, then the actual evidence underneath it, the entities involved, the numeric signals, the events that fired it (with reconstructed article text where I have it), and a chart of how the confidence has moved over time.
What surprised me is that the value is not really any single sentence. It is glancing at the feed and feeling the shape of the week: what is tightening, what is going quiet, where the gravity is moving. That is the thing I could never assemble in my own head from raw headlines.
Where it is weak, honestly
I would rather tell you this than have you discover it:
- It is most useful at horizons of 1 to 14 days. Past that, treat it as qualitative. The research on LLM forecasting is brutal about long horizons and I am not going to pretend I beat it.
- GDELT is noisy. The geocoder occasionally thinks a town in Texas called Jordan is the country Jordan. I filter for this, but noise remains.
- Coverage is curated, not learned. Every new domain needs a seed set of entities, which is real work.
- The model is still an unreliable narrator. Low temperature and stored prompt hashes make drift auditable, but not impossible.
Why I keep building it
Most of what I make is small, sharp, slightly-too-honest software for an audience of one: me. This started exactly that way, an answer to my own inability to feel where the world was heading. It turned out the interesting engineering problem was never "summarize the news." It was "build something that knows the difference between a strong signal and a real forecast, and is willing to tell you which one it has."
That is the line the whole system is organized around. In the next posts in this series I will go deeper into the parts under the hood: the entity graph and gravity, the pattern detectors, and the other feeds I built on the same engine.
This is the kind of thing I build at FlatNine. You can read the live News feed at intelligence.flatnine.co/news, and I post the builds @mikerubini.