I built a correlation matrix over my own life, part 3

Part 1 of this series computed a pairwise Pearson matrix over every trackable signal in my life. Part 2 fed the same rectangle through AutoCM and got back a graph instead of a list. Both are here: part 1, part 2.
In both of them, food was three columns: calories, protein, deficit. All three measure quantity. The matrix could tell me whether I ate more than usual on a given day and had no idea what I ate. This week I fixed that, and the first thing it told me was that I should eat fewer sweets.
Sweets cost me the next morning
Twenty-five of the last ninety days had something sweet logged on them. Thirty-six did not. Here is how the morning after each kind of day went:
| The next morning | After a sweets day | After a day without | Delta |
|---|---|---|---|
| Readiness | 85.3 | 91.8 | -6.5 |
| HRV | 54.2 | 59.6 | -5.4 |
| Resting HR | 65.6 | 64.4 | +1.2 |
| Sleep score | 93.8 | 94.8 | -1.0 |
As a correlation: r = -0.37 against next-day readiness and +0.30 against next-day resting heart rate, each over 57 usable day-pairs, each starred at the uncorrected five percent level.
Four numbers off the same wrist are not four independent confirmations, and I am not going to pretend otherwise. But they are not one number either, and every one of them moves the way you would expect if sugar cost me recovery: worse readiness, lower HRV, faster resting pulse, slightly worse sleep. Six and a half points of readiness, on a score that normally sits in the high eighties, is not subtle. Nothing else in the food data comes close to that consistency.
Dairy does nothing, and that is worth as much
If you had asked me before I ran this which food signal would move my recovery, I would have said dairy. I would have been wrong, and the wrong answer would have cost me a month of pointless restriction.
Forty dairy days against twenty-one without, and the next morning reads: readiness -1.2, sleep score +1.4, HRV +0.1, resting heart rate 0.0. Flat, and where it is not flat it points the wrong way for the hypothesis. That is a real null on the one thing I would have bet on, produced for the cost of a keyword list.
The day decides what I eat more than the food decides the day
The most useful thing I built was scoring every pair in both directions, because the arrow I assumed matters less than the one I did not:
- A day with more deep-work hours is followed by a lower ultra-processed share the next day (r = -0.31, 45 pairs).
- A day where I spent more money is followed by more fried food the next day (r = +0.41, 42 pairs, though only eight of those are fried days, so I am filing it as a hypothesis). Eating out has both a price tag and a grease content.
- A day where my weight went up is followed by a lower ultra-processed share (r = -0.38, 33 pairs). That one is me reacting to the scale.
Forward, the notable pairs are calories to the next morning's weight delta at r = +0.50 and protein to next-day sleep minutes at r = +0.45. The first is not a finding, it is the control: if eating more had not shown up on the scale the next day, the new plumbing was broken and nothing else in this post would be worth reading.
The graph disagrees with the matrix, in both directions
Part 2 ran my twenty-seven signals through Meta-AutoCM, the Semeion graph algorithm. Doing the same to the food columns took an afternoon, and it is where this gets interesting.
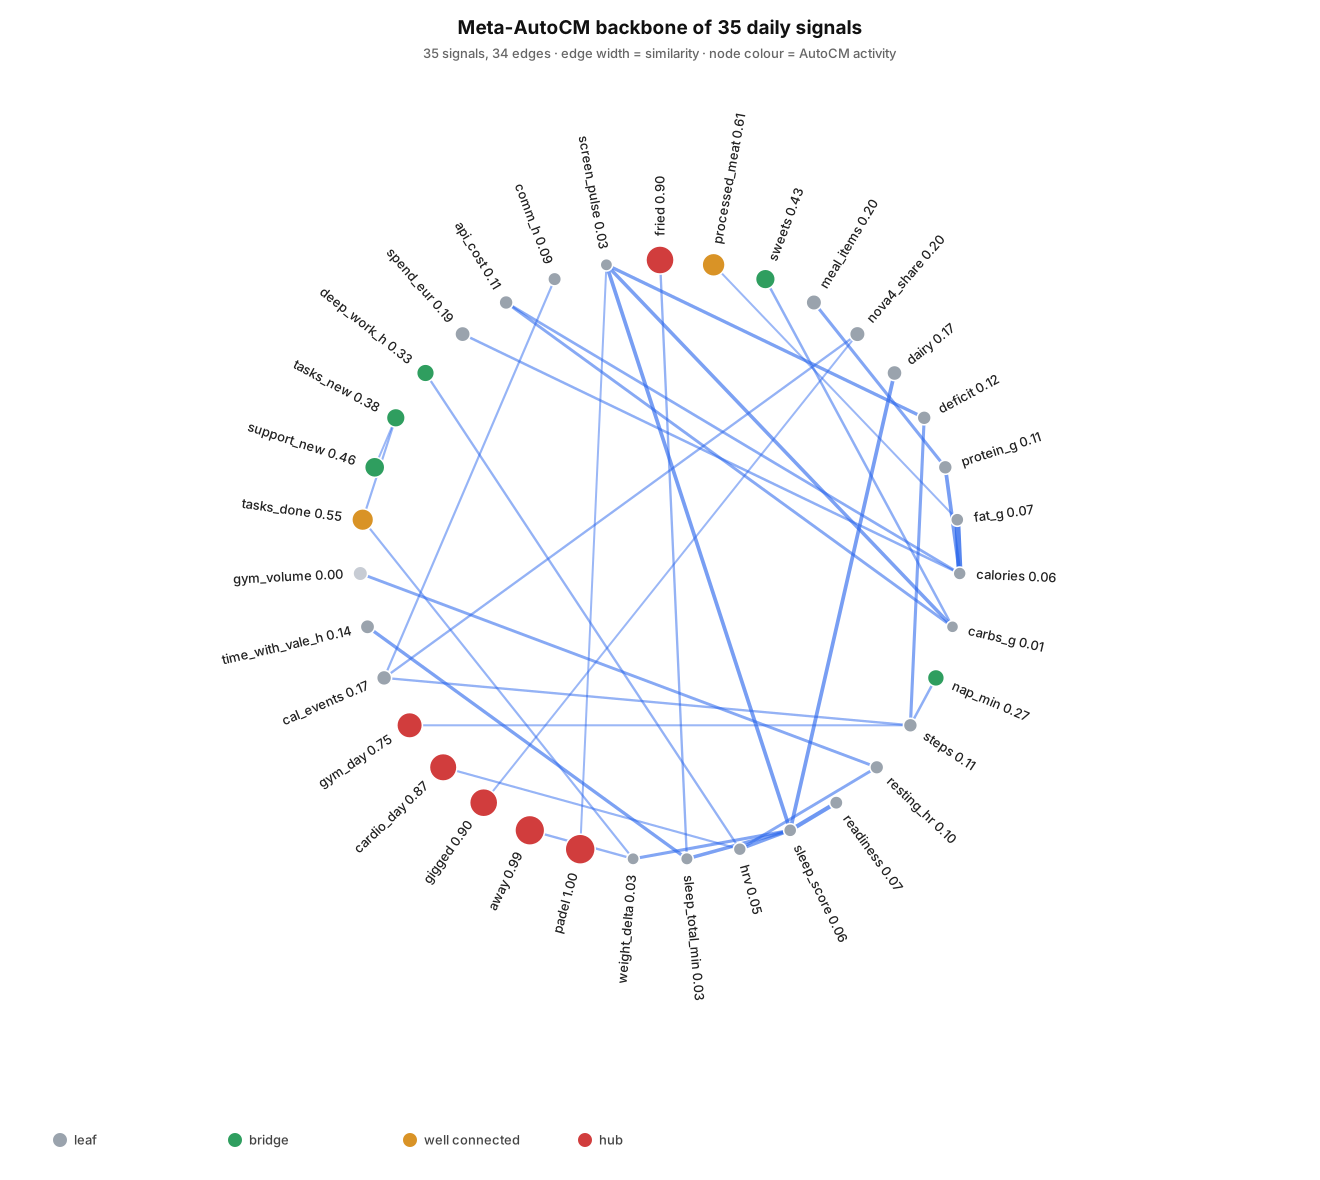
The yes-or-no switches run the network, and my food tags are now among them. Node activity: padel 1.00, away 0.99, fried 0.90, gigged 0.90, cardio_day 0.87, gym_day 0.75, processed_meat 0.61, sweets 0.43. Part 2 found the same set on top with the same shape of numbers on a different column set, which is a reproducibility check I did not plan and am glad passed. What is new is that three yes-or-no food tags walked straight into that group. Pearson rates those columns mid-tier because binary against continuous caps the r; the graph does not care.
The strongest non-trivial edge in the whole backbone is dairy to sleep_score at 0.73 - the signal Pearson just called a flat null. And sweets, my one Pearson finding, never touches readiness or HRV in the graph at all: its single edge runs to carbs_g.
Two smaller things from the graph. The ultra-processed share attaches to cal_events (0.50) and gigged (0.43) rather than to any body signal, which is the same story the reverse lag told: what I eat tracks what kind of day it is. And I owe part 2 a correction - I called those high-activity nodes "the structural centre", and every one of them turns out to have exactly one edge in the backbone. High activity, degree one. By summed edge weight the real hubs are sleep_score with six edges, screen_pulse with six, sleep_total_min and hrv with five.
One of my new columns was measuring me, not my food
Items logged per day correlates with next-day tasks closed at r = +0.68, which was briefly the strongest thing in the entire section. It has nothing to do with food. It measures how diligently I logged that day, and the days I am on top of my tracking are the days I am on top of my task list.
It is excluded from the findings by name now, kept in the table, and labelled as what it is. Any counter of "how many entries did I make" is a diligence metric wearing a data costume, and it will outrank your real findings if you let it.
What "how I feel" actually means here
I set out to correlate food against how I feel, and discovered that I do not record how I feel.
The feel side of this analysis is sensors: readiness, sleep score, HRV, resting heart rate. Those measure the state of the body, and calling that "how I feel" is a claim I have not earned. The page says so in as many words.
A mood scorer is wired up against my journal's mood field now, with a small one-to-five lexicon that returns null for any word it does not know rather than scoring it average. A Mood column appears in the matrix by itself once ten scored days exist. Which is a generous way of saying the missing feature is me typing one word a day.
The two tags I do not have
Two obvious ones are missing from my tag list. I do not drink, and I have never had a coffee in my life, so an alcohol tag and a caffeine tag would each be a column of zeros in every window I will ever run.
I built both on the first pass anyway, and each sat in the table as a row of "n/a" cells. That reads as "we looked and found nothing", which is not what happened: there was nothing to look at. A tag that can never fire carries no information about its effect on me, and rendering it the same way as a tag that fired twenty-five times is lying about which of the two it is. So they are out of the analysis entirely rather than kept as decoration.