Research as a collection of random variables

Last week I wrote that doing scientific research got cheap but coming up with good research questions did not. The thing which compounds when you work alone is machinery: a catalogue of datasets, methods and approaches you use to potentially solve hard problems.
My next idea was simple: what if we looked at a research process as a collection of random variables? In my view, you start with a a question, or a dataset. Then you formulate hypotheses and validate them through some methods. These are all variables, and a scientific paper in this process becomes then optional evidence of something that's working and peer-reviewed.
Once you write it that way, some things follow immediately.
A method that worked on one dataset has an untested claim attached to it: that it will work on the next dataset in the same domain. Testing that claim is cheap, because the code exists and the data exists.
One thing I've learned the hard way over the last year is that a paper should really answer one main question, otherwise it will lose coherence. That means that a dataset that answered one question usually has a second question sitting on it that maybe nobody asked, because the first question was the one that got funded, or maybe it's sitting in the "Future work" section. And a question that was answered on one corpus is a replication waiting for a second corpus, which is the single most useful and least glamorous thing anybody can do.
None of that is visible in a folder of papers. All of it is visible in a graph.
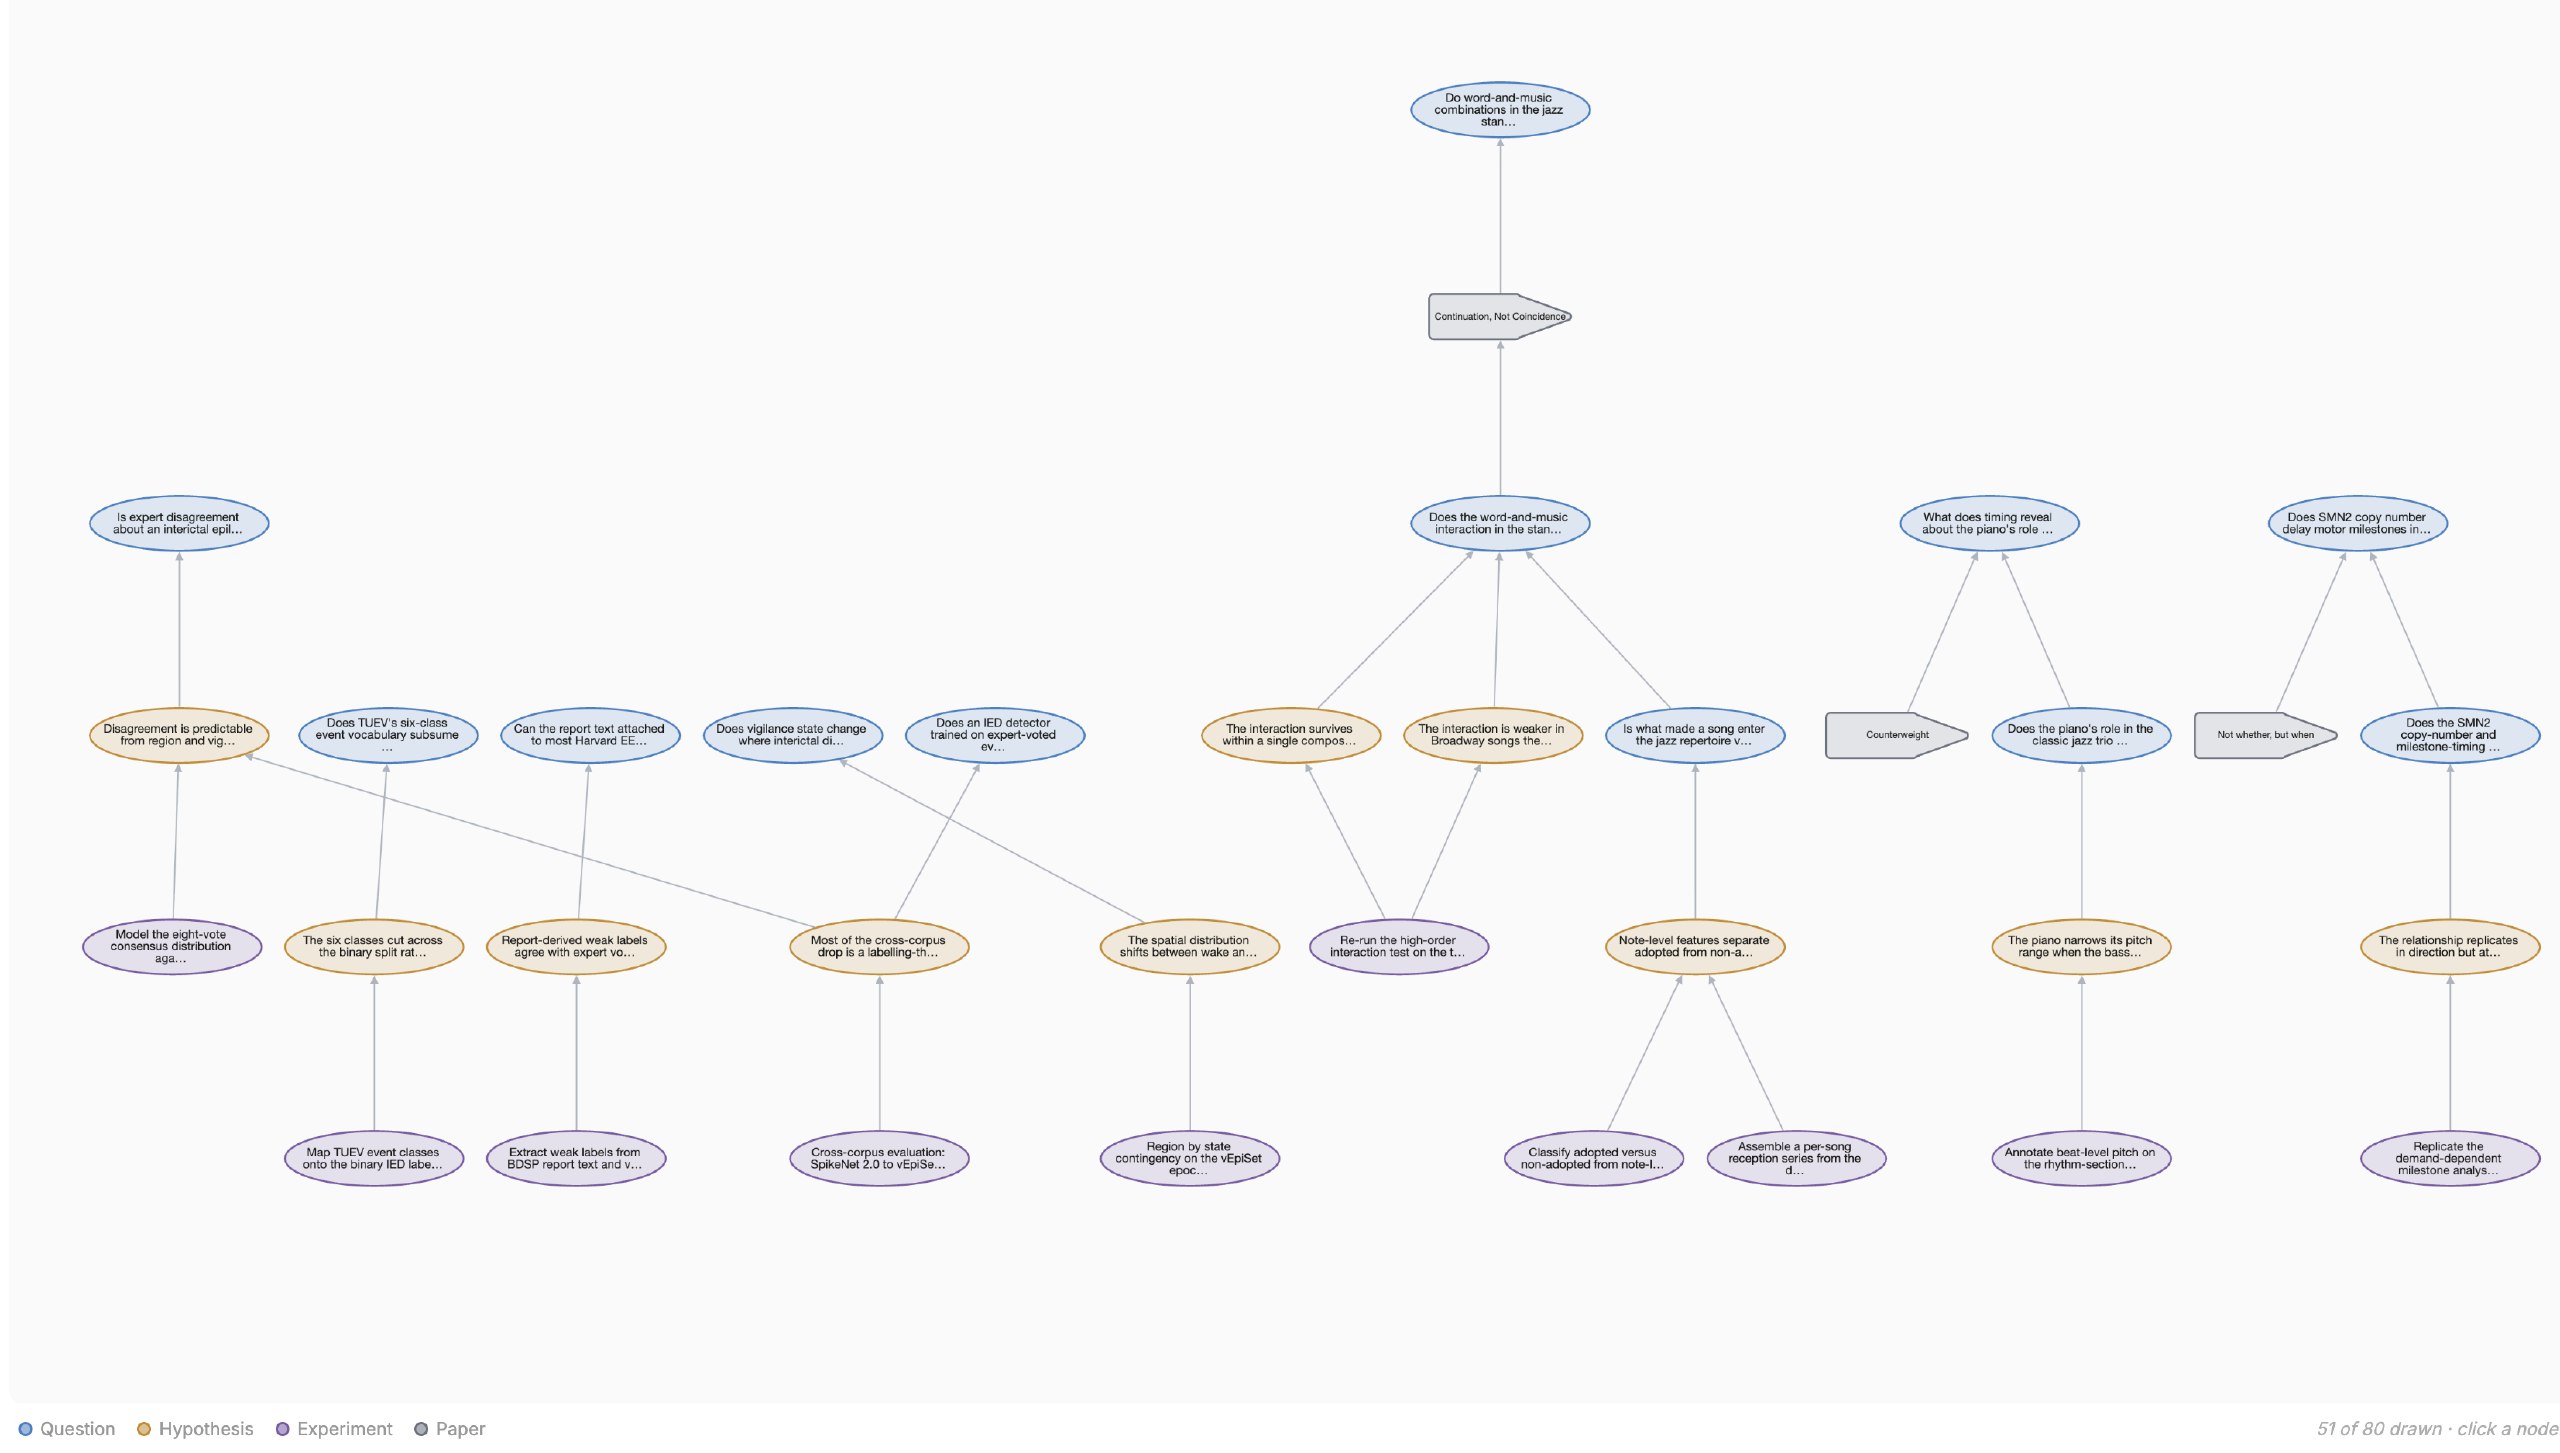
So I built one. A DAG, specifically. Questions, hypotheses and experiments as nodes. Typed edges between them: a hypothesis answers a question, an experiment tests a hypothesis, an experiment uses a method and a dataset, a result yields a paper, an experiment replicates another, a finding contradicts a finding. The edge table refuses a cycle, because a research programme that depends on its own conclusion is not a programme. As I mentioned, a paper, in this picture, stops being the unit of work. It becomes what it always was in practice: the collected evidence that one path through the graph held up.
The status of my research graph
Eleven question nodes. All eleven marked answered.
Every single one was a back-link from a paper I had already written. There was not one open question in the entire structure. So I seeded it properly: nine open questions, ten hypotheses, ten planned experiments, eighty-six edges. Every hypothesis carries what would confirm it and what would kill it, written down before any data is touched, along with the confound most likely to fake the result. Every experiment names the methods and datasets it would consume.
Two of the clusters were nearly free. Three of my songbook corpora turn out to share an identical schema, one row per note with syllable, chord at onset, pitch, duration and key-invariant degrees. A test I ran on one of them can run on the other two with no new tooling at all. That is the cheapest result available to me right now, and it was invisible until the datasets sat next to each other as rows rather than as folders.
Paradigma
While I was doing this, I found Paradigma, whose homepage says they are building the infrastructure for autonomous research.
Their essay The New Age of Research makes the argument better than I would:
In such a world, the question is no longer only who has the best model, but who has the best structure for turning intelligence into cumulative knowledge.
And then, precisely:
the real bottleneck shifts to infrastructure: how hypotheses are represented, how experiments are attached to them, how replications and objections are tracked, how results are surfaced.
They call their version Flywheel, and describe it as a ledger for a research project that makes each step explicit, the way git does for software. They used it to import the state of the art on the Riemann Hypothesis as a graph and then pointed an agent at the frontier of that graph to push it. Their lab has also shipped a one-billion-parameter model for mathematical reasoning that scores 94.01% on AIME 2026.
I want to be clear about the asymmetry. They have a team, a trained model and a funded lab. I have a laptop and eleven single-author papers. I am not claiming to have built what they are building.
The convergence is the point. Two parties with completely different resources, looking at what research becomes when execution gets cheap, both arrive at the same primitive: not a better model, a better structure. And the specific thing they name that I had underrated is the preservation of negative results. In a folder of papers, a null finding is something you quietly do not write up. In a graph, a hypothesis marked rejected is an edge, and the next person does not spend their afternoon rediscovering it.
Auto-expanding the graph
The last piece is a feed. Eight topics drawn from the portfolio, each one naming the paper or open question it serves, queried daily against arXiv and Europe PMC. I got 119 papers in the first 21 days. I set up a judgment pass (hello Jev!) then reads the week, rules on every row, and is allowed to flag at most five.
The first flag was handy! One of my planned experiments carries the note that the dataset does not exist until this runs: it is my own beat-level pitch annotation over 1,182 jazz piano performances, and the work is weeks of it. The feed surfaced JazzSAMBA, released in September, which is 76 standards played by eight musicians with per-stem audio and MIDI and timed annotations for bars, chords and soloists. It does not replace my annotation, because they are different performances. It does mean the question becomes answerable on an openly distributed corpus rather than only on a private one, which is the difference between a result others can re-run and a result they have to take my word for.
The hypothesis was less than a day old. Under the old arrangement I would have found that paper at peer review, after running the experiment.
Parsing new research meaning I can automatically feed new models, better questions and hypotheses into the graph.
What this buys
This doesn't buy ideas. I have more of those than time. This buys time. You can test questions and hypotheses quickly and the researcher becomes a reviewer of which questions or hypothesis is worth pursuing, or not.